
Several insurance blog posts have been “touting the State of The Line” of how well the Workers’ Compensation (WC) Insurance industry is profiting despite several years of rate reductions. So why is workers’ compensation insurance hitting these low combined ratios in the last few years? Is it great claims management, masterful underwriting pricing models on individual risks, or highly effective loss control? The answer is very simple and found in just three slides of the 57-page presentation (click here). But more importantly, one national economic measure has the greatest effect on workers’ compensation insurance.
There is no doubt that since 2001, the world of investment income has turned the insurance industry on its head compared to the 1990s which boasted an average investment return of 19% – 20% on the S&P 5001. A combined ratio over 100% posed little threat to carrier profitability, let alone survival. But since 2001, the reduced investment income opportunity has forced the industry to aim for that underwriting profit to keep insurance carriers solvent and keep the states from having to manage claims from carriers in receivership.
The best predictor of the ability of workers’ compensation insurers to have an underwriting profit lies in national unemployment rates. Figure 1 below is a double access chart that maps the WC Combined Ratio from the NCCI 2019 State of the Line Report (slide 26) and the U.S. Unemployment Rate by year from the US Bureau of Labor Statistics. You will notice that the two factors track together since 2001.
Figure 1: WC Combined Ratio vs. U.S. Annual Unemployment Rate
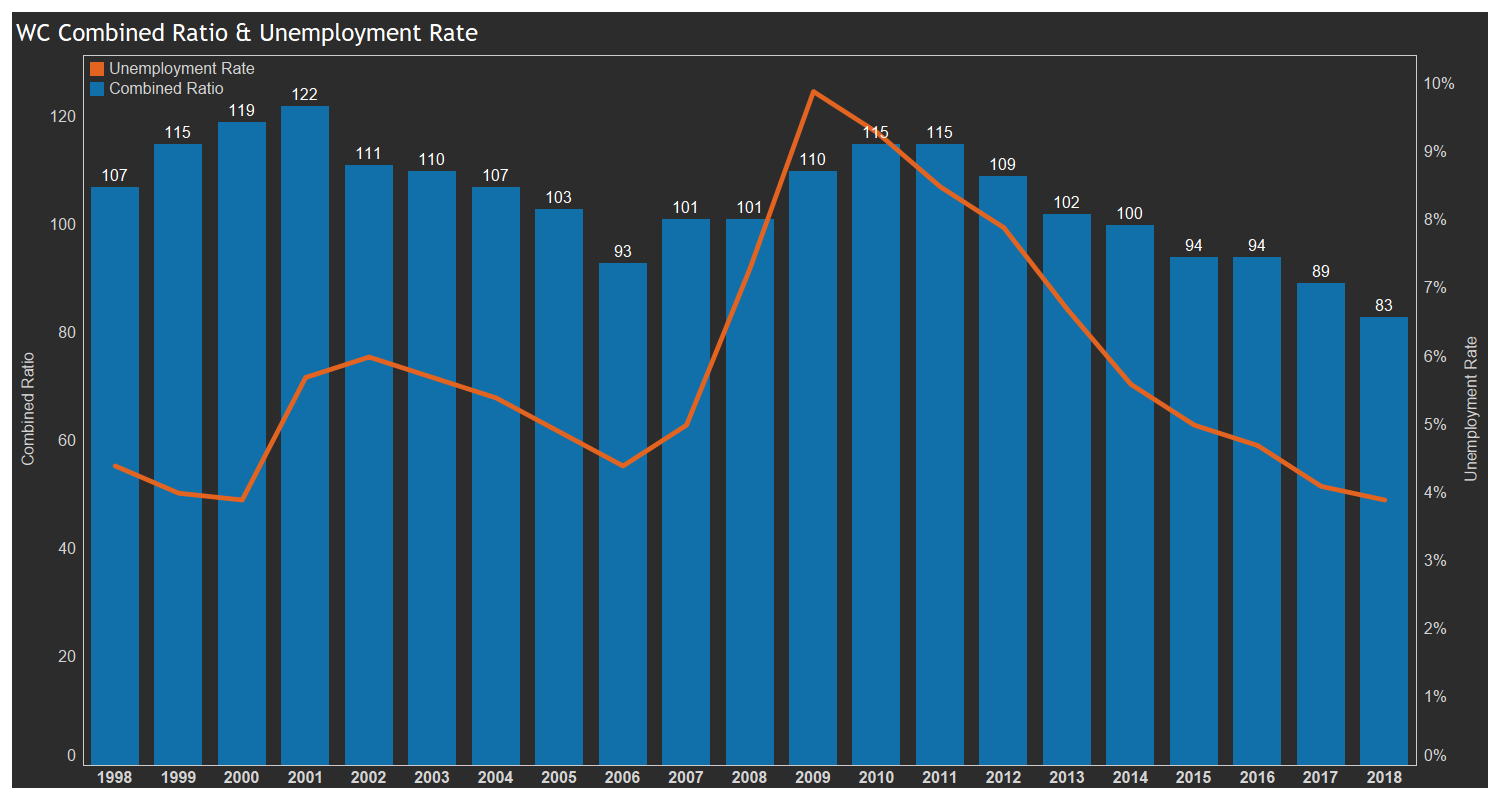
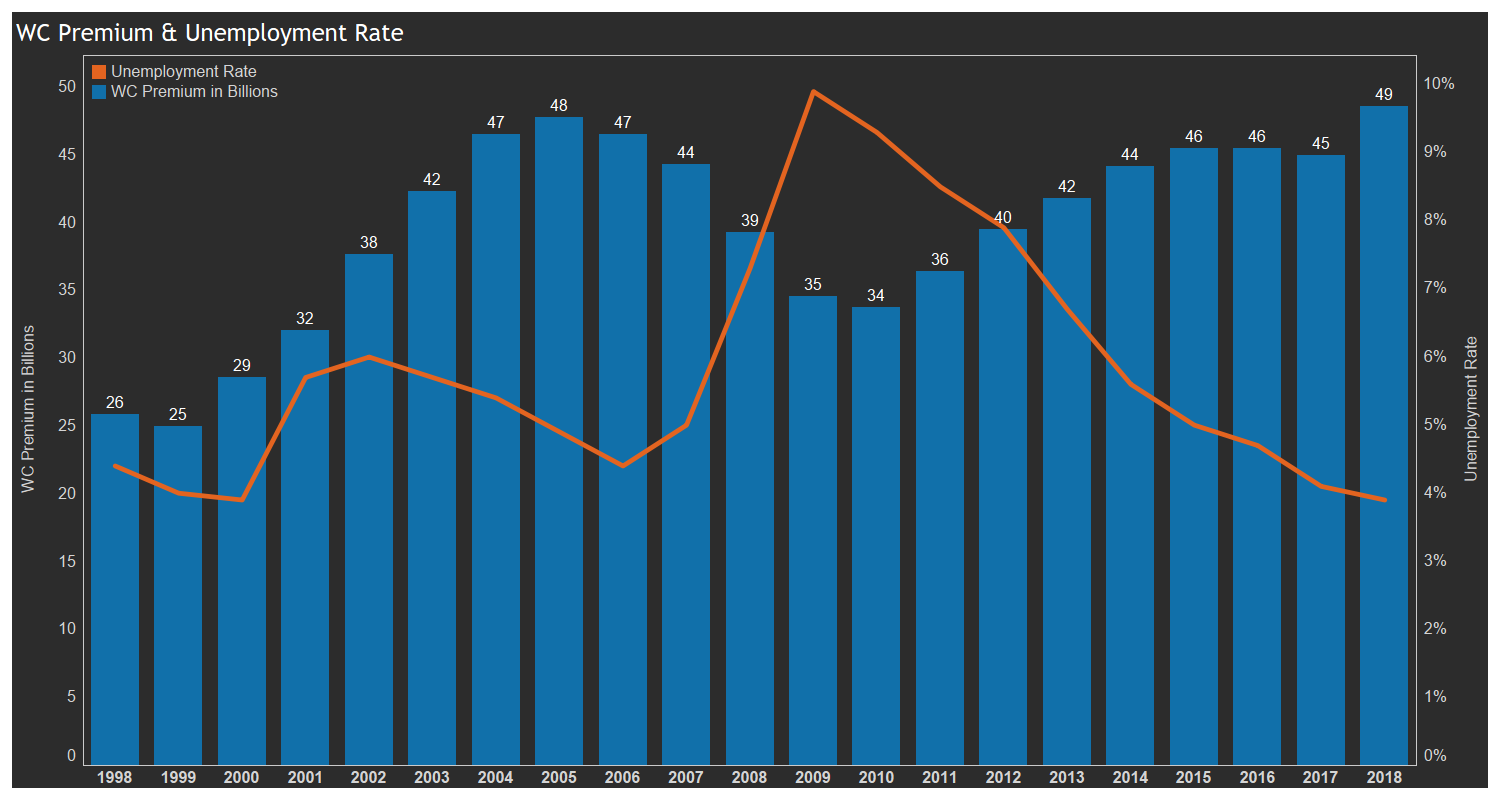
The matching trends indicate that when unemployment is high, there is simply not enough premium-generating payroll to equate to a sub-100% combined ratio. Figure 2 maps the WC Premium (Page 12 of the State of the Line Report) against the unemployment rate from the Bureau of Labor Statistics. Notice that the premium amount tracks inversely with the unemployment rate and thus also with the WC combined ratio. This is an indication of the effect of the largest number in the WC equation – employee payrolls – has on the ability of the insurance industry to reach profitability.
Figure 2: WC Premium vs. U.S. Annual Unemployment Rate
So, what is the magic number unemployment number? For the Workers’ Compensation Insurance Industry to have an underwriting profit, the past 17 years tells us that the national unemployment rate must be 5% or below. Unemployment hit 5% or less seven times since 2000: 2005, 2006, 2007, 2015, 2016, 2017, 2018. Apart from 2005, each of those years resulted in the Workers’ Compensation Industry producing a combined ratio at 100% or less. In addition WC Net Written Premium exceeded $44 Billion for the industry in each of those years.
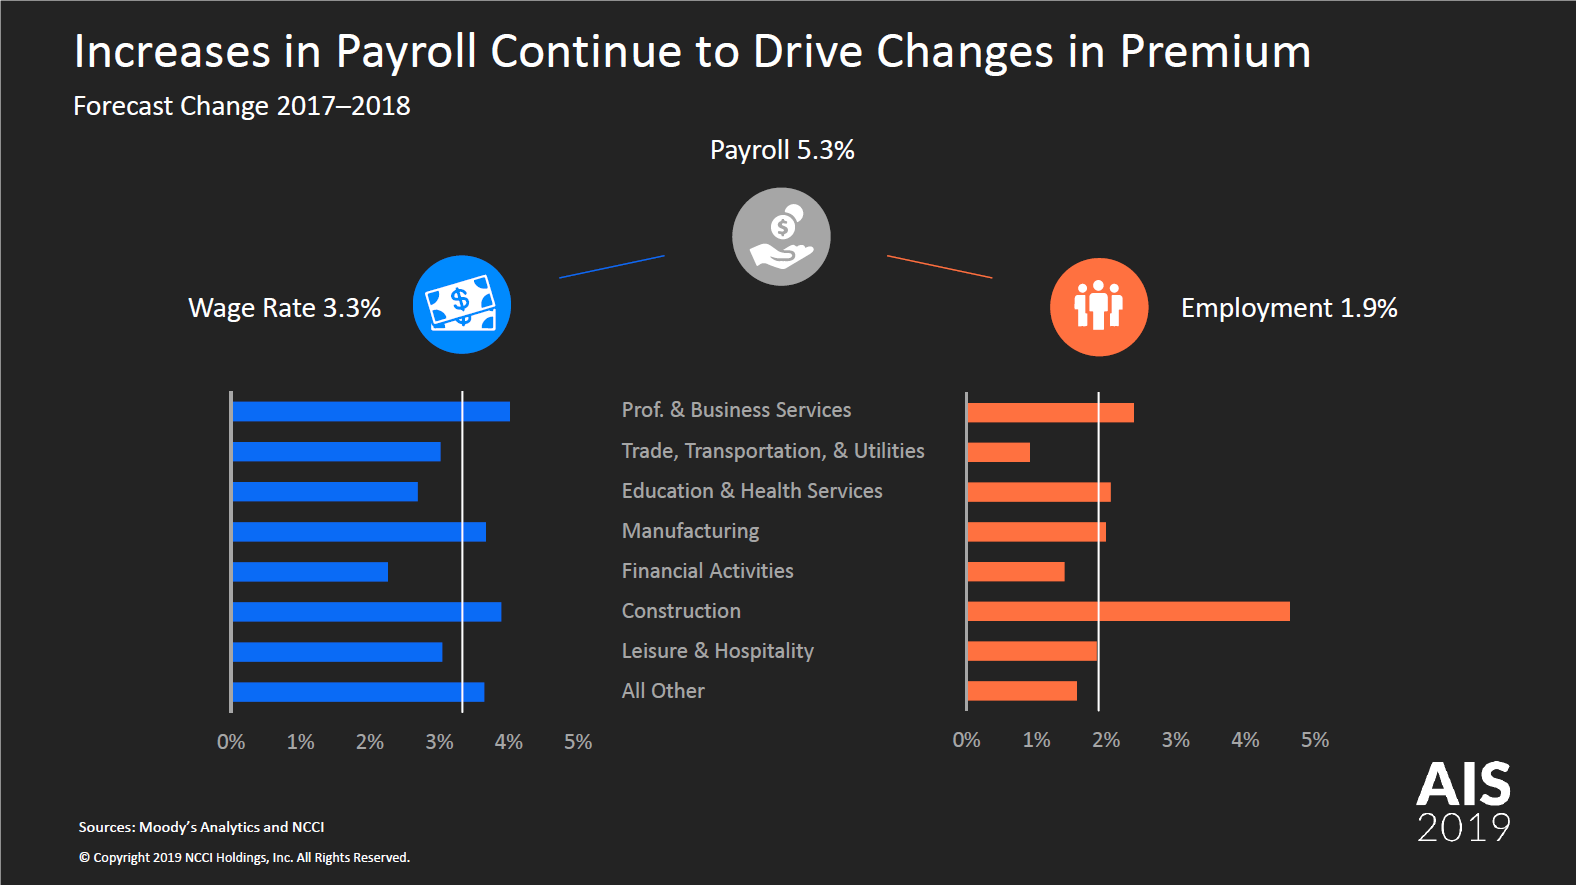
Where do these payroll boosts come from? The answer is predominantly found in slide 18 of the State of Line Report (see Figure 3 below). Rise in construction employment is the key for premium growth for the industry. Employment growth in construction was nearly double all other industry groups in 2018. Slide 18 clearly shows that payroll growth was at 5.3% from 2017-2018, yet premium growth rose nearly 10% ($45B to $49B). Construction as a class of business, has the highest lost costs and manual rates of any of the industry groups, perhaps apart from Trade, Transportation and Utilities, listed on the slide up to 3 to 10 times per hundred in payroll. More payroll in the class codes with the highest rates equates to the higher premium.
Figure 3: Increases in Payroll Continue to Drive Changes in Premium (NCCI State of the Line, slide 18)
Considering this correlation to the recent growth in construction employment, we decided to track a more specific national statistic against WC Premium: New Housing Starts. Figure 4 below maps the WC Premium against the annual monthly average number of new housing starts from 1998 through 2018. The analysis speaks for itself.

What does this tell us about Workers’ Compensation Insurance ratemaking and adjustments? We can possibly infer a couple of issues: 1. The Construction Industry loss costs may be over-priced, or 2. the non-construction loss costs may be significantly underpriced as a whole. This may explain why NCCI and the independent bureaus have to drastically increase loss costs and manual rates when construction payrolls decrease to try to keep carrier solvent.
Click here: https://www.ncci.com/Articles/Documents/AIS2019-SOTL-Presentation.pdf